
Introduction
PhD Research types rely on quantitative data analysis with statistical and computational techniques to understand the information in the numerical data, including cross-tabulation referring to drawing inferences from datasets in a tabular format and Max Diff Analysis for understanding the response of respondents by determining the most or least preferred alternatives. Descriptive statistics summarize data by percentages or means, while inferential statistics predict the features for a larger population from such summarized data.
It was an increasingly data-driven world in which businesses and researchers were engaged in quantitative analysis for obtaining insights, optimizing processes, and taking informed decisions. The ability to convert raw data into meaningful discoveries is one important skill area for disciplines such as finance, healthcare, marketing, and engineering. The blog is covering the basic principles of quantitative analysis, why it matters, and how it can make a difference.
Understanding Quantitative Analysis
Quantitative analysis, as its name implies, looks systematically at numerical data following mathematical, statistical, and computational methods. Collection, processing, and analysis of data for the purpose of observing patterns, hypotheses testing, and predicting outcomes fall into quantitative analysis.
Essential Aspects of Quantitative Analysis
1. Data Collection – Obtain credible and relevant numerical data using surveys, experiments, and/or existing datasets.
2. Data Processing – Cleaning, organizing, and preparing data for pertinent analysis.
3. Statistical Methods – Descriptive and inferential statistics used for interpretation of data.
4. Visualization – Represents data insights through charts, graphs, and dashboards.
5. Modelling & Prediction – Using machine-learning and statistical models to predict trends.
How does quantitative data analysis differ from qualitative analysis in research?
By its utility, quantitative analysis considers number-based data with an application of statistical computation to answer the questions of how many and how much. It attempts to quantify variables and generalize results from a sample to a population. In contrast, non-numerical data focus on understanding concepts, thoughts, or experiences and usually use interviews or observations as methods. Quantification by
Using metrics and numerical figures, quantitative is qualitative, exploring the depth and complexity of data without quantifying.
The Importance of Quantitative Analysis
1. Informed Decision-Making
Organizations can employ data-driven insights to make justified decisions and thereby temper uncertainty while enhancing efficiency.
2. Identifying Trends and Patterns
With the help of analysis of the past data, an organization can detect market trends, consumer behaviour, and future possibilities for growth.
3. Optimizing Performance
The analyzing of performance metrics enables organizations to enhance their strategies and operational efficiency.
4. Risk Assessment & Management
Quantitative analysis helps in the assessment of financial risks, prospects for investment, and monitoring of quality during production.
Actual Applications of Quantitative Analysis in the World
Business and Marketing
- Market segmentation and analysis of customer behaviour
- Performance metrics tracking and measuring campaign effectiveness
Healthcare and Medicine
- Predictive analytics for disease detection
- Analysis of clinical trials and studies on drug effectiveness
Finance and Economics
- Forecasting stock market trends
- Analyzing risk in investment portfolios
Engineering and Technology
- Assessment of performance in software and hardware systems
- Quality control and optimization in manufacturing
Quantitative Analysis Tools and Techniques
Importantly, the following tools and programming languages make up the quantitative analysis toolkit:
• Excel & Google Sheets – For elementary data analysis and visualization
• Python & R – Scientific calculations for advanced statistical modelling and machine learning
• MATLAB – Computational analysis made major for engineering and scientific research
• SPSS & SAS – Special purpose analytical software
• Power BI & Tableau – Business intelligence and data visualization software packages
Conclusion
Quantitative analysis is quite the rigorous means of converting data into actionable intelligence. In every field, whether business, healthcare, finance, or engineering, effective harnessing of data leads to good decisions, increased efficiency, and improved results. With this competency in quantitative analytical techniques and tools, professionals glean new insights to success within the respective domains.
If you're looking to advance your career and improve your data analysis skills, check out our IT & software courses at Takeoff Projects for hands-on learning with Python, MATLAB, and more!
 PhD in Electrical Engineering: Research & Writing Support
  Which are the Best PhD Assistance and Dissertation Writing Services in India?
  How to Choose a PhD Research Domain: EEE, ECE, or CSE?
  The Ultimate PhD Toolkit for EEE, ECE and CSE Students
  Publication Success in EEE, ECE, and CSE: Expert Tips for Engineering Scholars
  Your PhD Guide to Multi-Disciplinary Research in Engineering and Technology
  Top PhD Topics across EEE, ECE, and CSE: Bridging Innovation and Impact
  Top Embedded Systems Projects for Engineering Students
  Crafting the Future of Tech: PhD Research Trends in Software Engineering
  From Algorithms to Applications: Comprehensive PhD Support for CSE Students
  Cybersecurity and Blockchain: Pioneering Research Areas for PhD Scholars
  The Art of Writing High-Impact Research Papers in CSE Domains
  AI, ML, and Big Data: Emerging PhD Topics in CSE to Watch
  Top Research Trends in Electrical Drives for Aspiring PhD Scholars
  Transforming Ideas into Impact: Dissertation Help for EEE Scholars
  Navigate Your PhD with Confidence: Comprehensive Assistance Every Step of the Way
  ECE Dissertation Success: Expert Tips for Writing and Publishing your Academic Success
  Breaking Barriers in Signal Processing: PhD Research Simplified
  Building the Next-Gen Tech: A Guide to ECE Research and Publication
  From Circuits to Control Systems: Navigating EEE Research with Expert Guidance
  Future of IoT and Wireless Communication: Top PhD Opportunities in ECE
  Top PhD Topics Energy Management in Power Electronics
  Exploring VLSI Design and Embedded Systems: Winning Research Topics for ECE Scholars
  Expert-Approved Techniques for Crafting a Winning PhD Synopsis
  Writing with Purpose: How to Create Engaging Seminar Papers That Stand Out
  Unlocking Publication Success: Your Guide to High-Impact Journal Articles
  Mastering Energy Management: Top PhD Topics in Power Electronics
  PhD Topic Selection Simplified: Choosing What Matters Most to You
 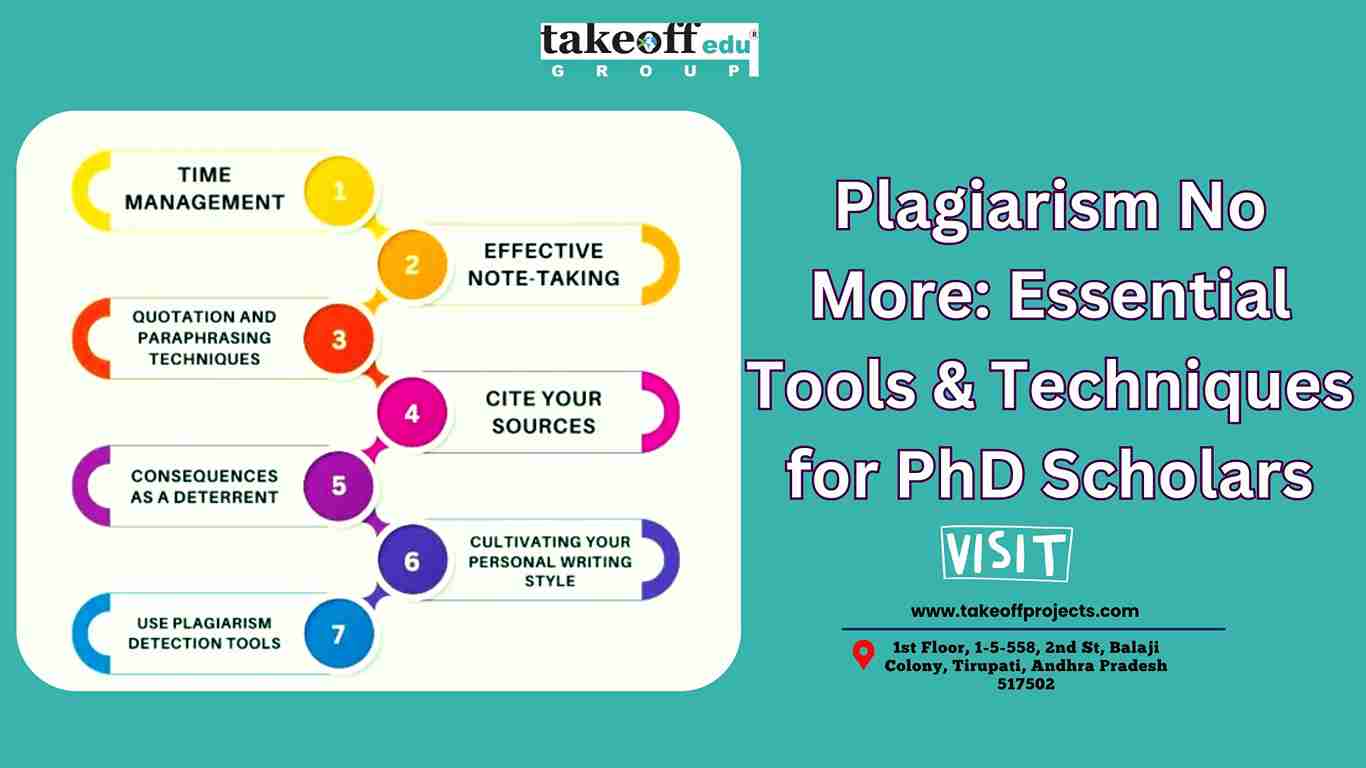 Plagiarism No More: Essential Tools and Techniques for PhD Scholars
 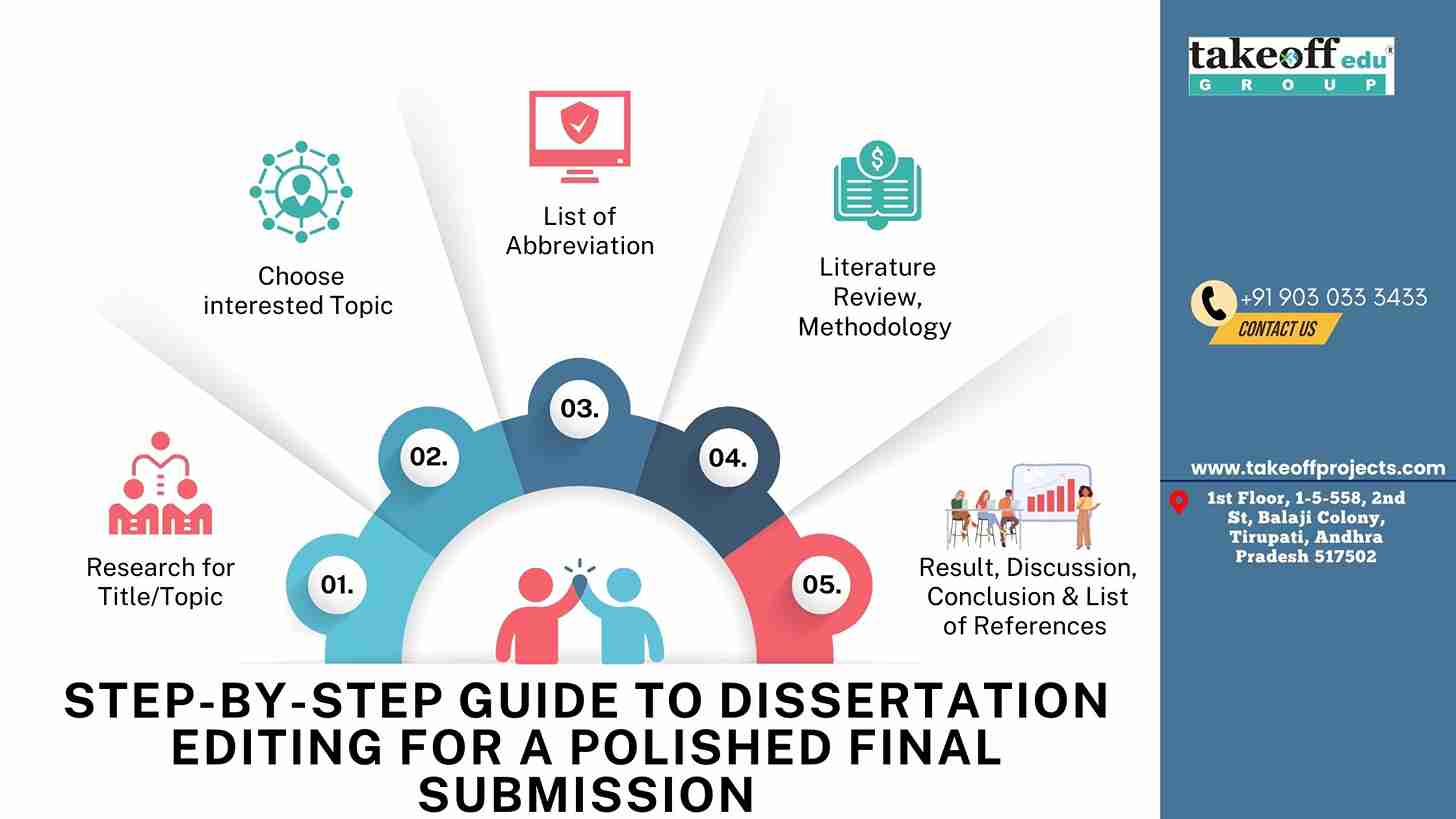 Step-by-Step Guide to Dissertation Editing for a Polished Final Submission
  Why Literature Review Is the Backbone of Your PhD Research?
  Accelerate Your Research: Software Implementation Made Easy for PhD Students
  Stress-Free PhD Viva Voce Preparation: Expert Tips to Impress Examiners
  Transforming Data into Insights: Qualitative and Quantitative Analysis Explained
  The Art of Problem Identification: Laying the Foundation for PhD Success
  Say Goodbye to Plagiarism Worries: A Guide to Flawless Dissertation Writing
  From Idea to Impact: Crafting High-Quality Conference and Seminar Papers
  Crack the Code of Successful Publications: Comprehensive PhD Support
  Top Strategies for Writing a Journal Ready Manuscript with Zero Plagiarism
  How to Nail Your PhD Research Proposal: Tips from the Pros
  Understanding the Basics of Power Systems: A Comprehensive Guide
  Turn Research Challenges into Opportunities: Expert PhD Consultation Services
  Mastering MATLAB for ECE: A Beginner's Guide to Digital Image Processing
  Mastering Your PhD Journey: From Topic Selection to Dissertation Success
  Assignment Writing Service
  PhD Research Assistance
  PhD Thesis Writing Services
  Masters Dissertation Writing
  Journal Paper Writing
  Research Paper Writing Services
 Paper Publishing