Introduction
Analysing signal behaviour in the frequency domain is typical in engineering projects. Depending on the data label from the sensor, vibration signals, audio recording, or biomedical inputs, PSD has been utilized to impress the contents of frequency hidden within time series data upon the observer.
Power Spectral Density (PSD) is the best tool for hidden frequency content in time-varying signals, making essential for everyone work with complex data. Whether trying to identify noise in audio track and how a structure reacts to stress, PSD provides insights that really on time-domain analysis.
In this blog, we are going to dive into basics of PSD and will show you how to use spectral estimation methods in MATLAB and explore some real-world examples in different engineering fields.
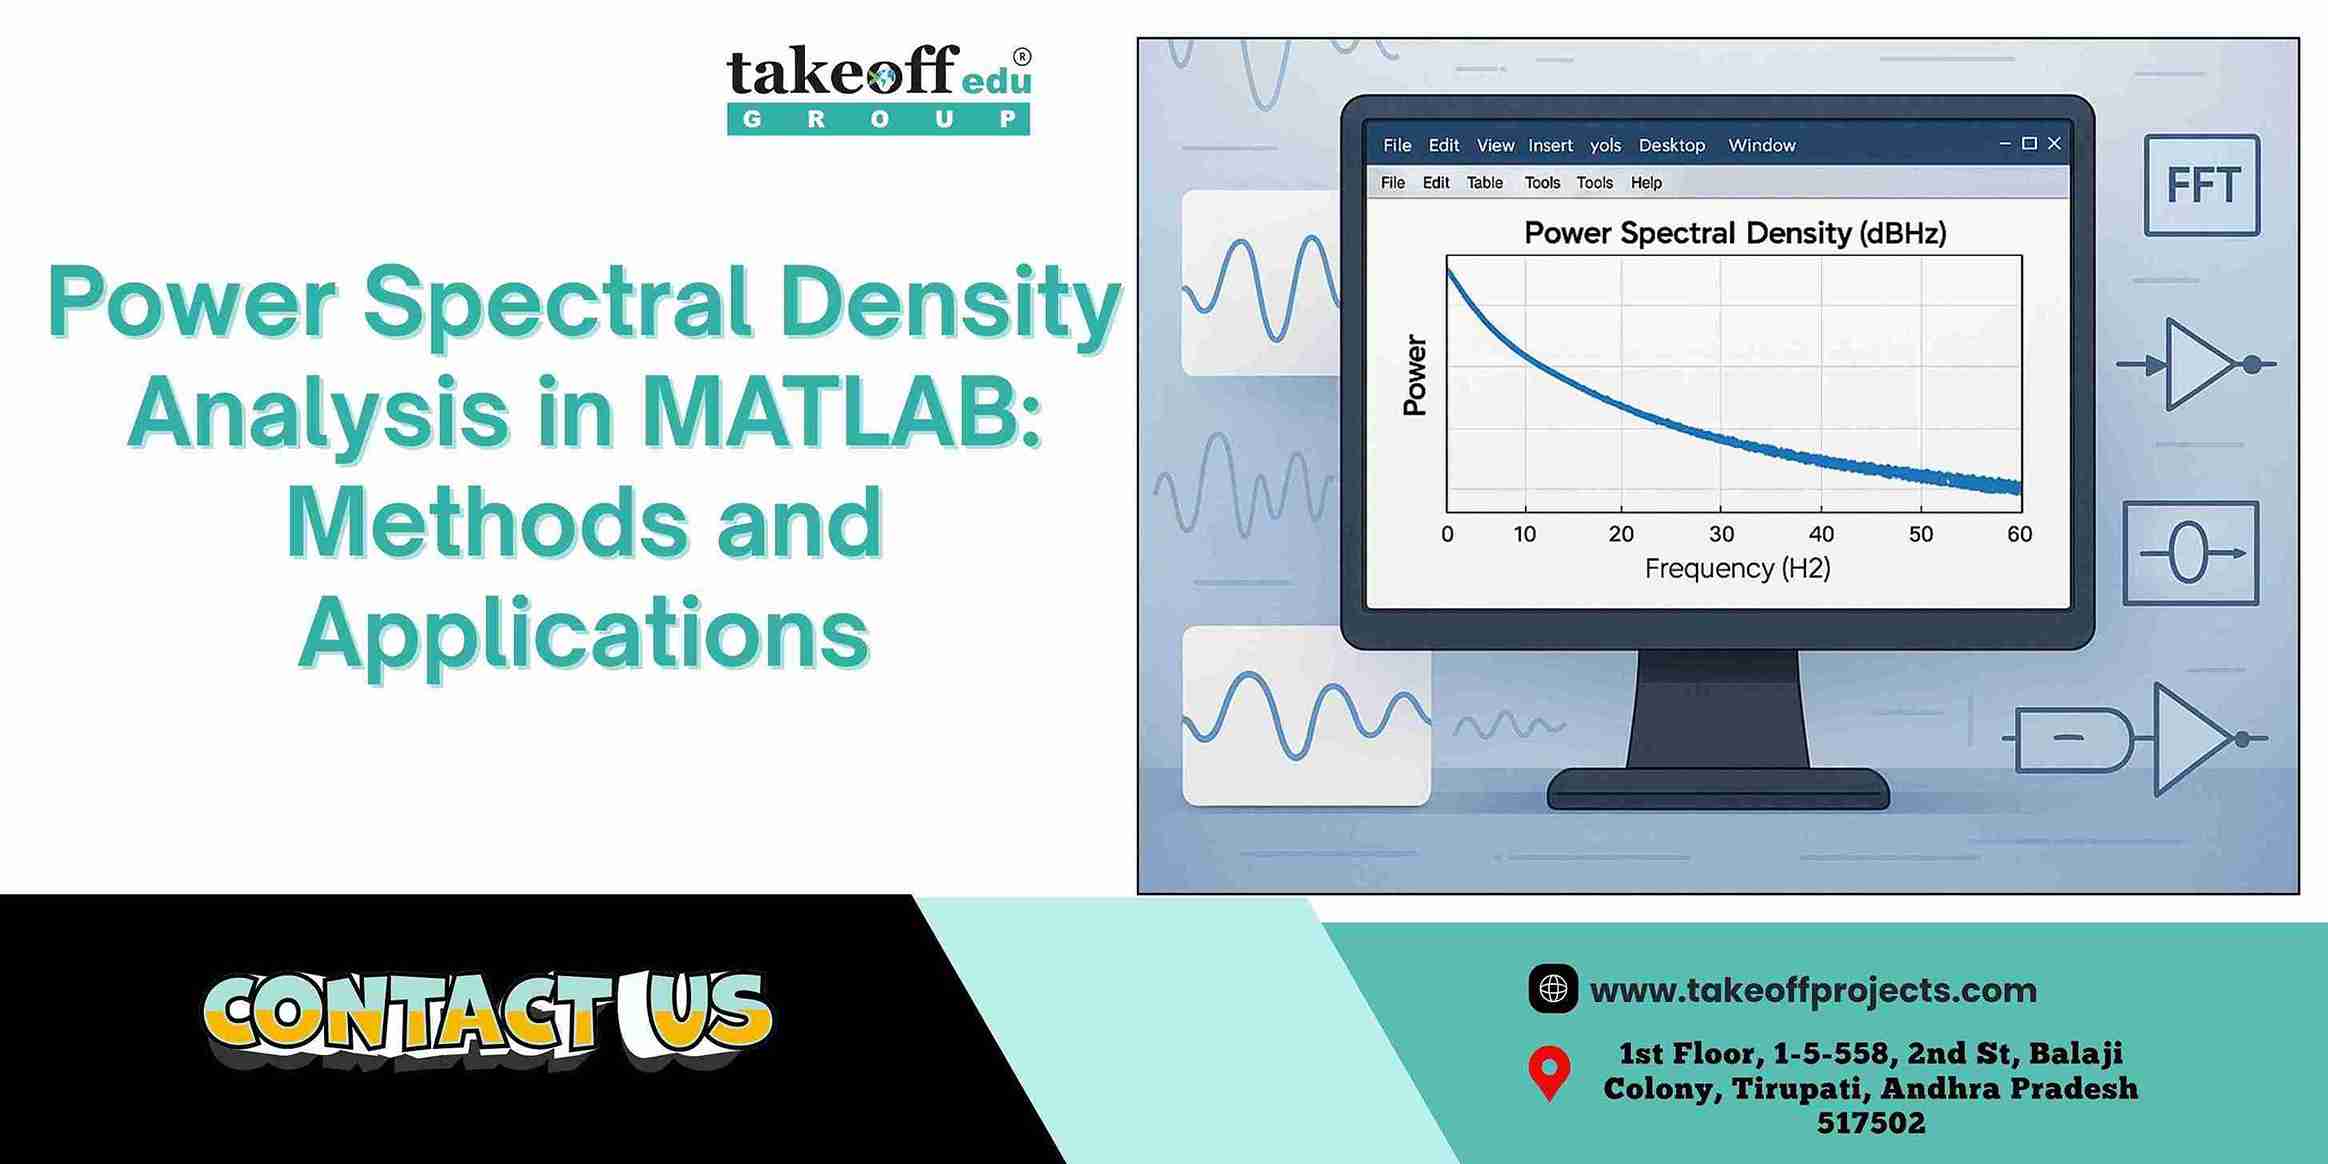
What is Power Spectral Density (PSD)?
Power Signals Across various frequencies is to use Power Spectral Density (PSD). Instead of looking at how a signal changes over time, PSD shifts the focus to the frequency domain, highlighting which frequencies carry the most energy. Finding patterns, detecting undesired noise, or identifying system problems can all be greatly aided by this. PSD assists you in understanding what's actually happening beneath the surface, whether you're working with electrical signals, mechanical vibrations, or biomedical data.
Why PSD Analysis Matters in Engineering Projects?
Power
Spectral Density (PSD) analysis is not just a theoretical concept; it has
practical uses in many engineering applications. The following factors make it
a valuable tool to have in your toolbox:
• Expose Hidden Frequencies: By
identifying frequency components that aren't visible in the time domain, PSD
makes it easier to identify interference or subtle patterns in signals.
• Recognize Noise Behaviour: You can
more effectively identify and separate undesired disruptions in sensor or
system data by decomposing the frequency content of noise.
• Diagnose System Problems: Abnormal
frequencies are frequently the first sign of a malfunction. PSD facilitates the
identification of components exhibiting unexpected behaviour.
• Extract Valuable Features:
Frequency-based features from PSD can enhance model performance and accuracy in
machine learning and data classification tasks.
MATLAB Spectral Estimation Techniques
A range of trustworthy tools for calculating Power Spectral Density (PSD) are available in MATLAB, which facilitates the analysis and interpretation of signal behaviour at various frequencies. Some of the most popular techniques in engineering research and project work are listed below:1. The Periodogram Approach
One of the simplest and most popular methods for PSD estimation is the periodogram. T To analyse a time-domain signal and separate it into its frequency components, we rely on the Fast Fourier Transform (FFT).
• How it works: FFT is employed to transform the signal after it has been windowed, usually a Hann window. The power at each frequency is estimated by the FFT's squared magnitude.
• Ideal for: Rapid analysis and comprehension of the general frequency structure of
x = randn(1024,1); % Sample signalFs = 1000; % Sampling frequency (Hz)periodogram(x, [], [], Fs); % Basic periodogram plot2. Welch’s Method (Recommended for Projects)
By averaging several overlapping signal segments, Welch's method improves the periodogram by lowering noise and boosting stability.
pwelch(x, hamming(256), 128, 512, fs);
title('Welch PSD Estimate');
3. Multitaper Method
For improved variance control, particularly for non-stationary signals, this method employs multiple orthogonal tapers.
pmtm(x, 4, [], fs);
title('Multitaper PSD Estimate');
4. AR Modeling (Yule-Walker)
Used for high-resolution requirements or brief data samples. Perfect for simulating systems with a limited number of dominant frequencies.
pyulear(x, 8, 512, fs);
title('Autoregressive PSD Estimate');
PSD Engineering Uses in MATLAB
1. Biomedical Signal Processing
In projects involving EEG or ECG data, PSD helps with rhythmic activity analysis and the identification of anomalies like seizures or cardiac arrhythmias.2. Monitoring of Structural Health
PSD can be used to analyse vibration data from machinery or bridges in order to find imbalances, misalignments, or early-stage faults.3. Systems of Communication
PSD facilitates the assessment of wireless systems' interference, bandwidth consumption, and spectrum efficiency.4. Projects Using Audio Signals
PSD makes the spectral content of recorded signals visible for speech analysis, noise reduction, and audio filtering.5. IoT and Embedded Systems
PSD analysis can be used to process low-power sensor data and find pertinent frequency patterns for alert or event detection systems.Benefits of MATLAB for PSD Analysis:
• Integrated spectral analysis tools;
• Plots that are interactive for visualization;
•
Accurate results with little code
• Perfect for both offline and real-time analysis; toolbox integration (Signal
Processing Toolbox, DSP System Toolbox)
Conclusion
Understanding
how to conduct Power Spectral Density Analysis in MATLAB is very beneficial for
both engineering professionals and students. Welch, Multilayer, and AR
modelling are examples of spectral estimation techniques that can be used to
extract significant frequency information from time-series signals. Whether
you're working on biomedical applications, IoT systems, audio analysis, or
industrial diagnostics, PSD analysis should be an essential component of any
engineering project.
Use MATLAB to streamline your workflow, gain deeper comprehension, and generate
important engineering solutions.
 Enhancing Security in 5G Device-to-Device Communication with a Secure Gale-Shapley Algorithm
  MATLAB Projects in 5G and Beyond: Beamforming, NOMA and More
  Design and Simulation of MIMO Systems Using MATLAB
  Speech and Audio Signal Processing in MATLAB: From Basics to Projects
 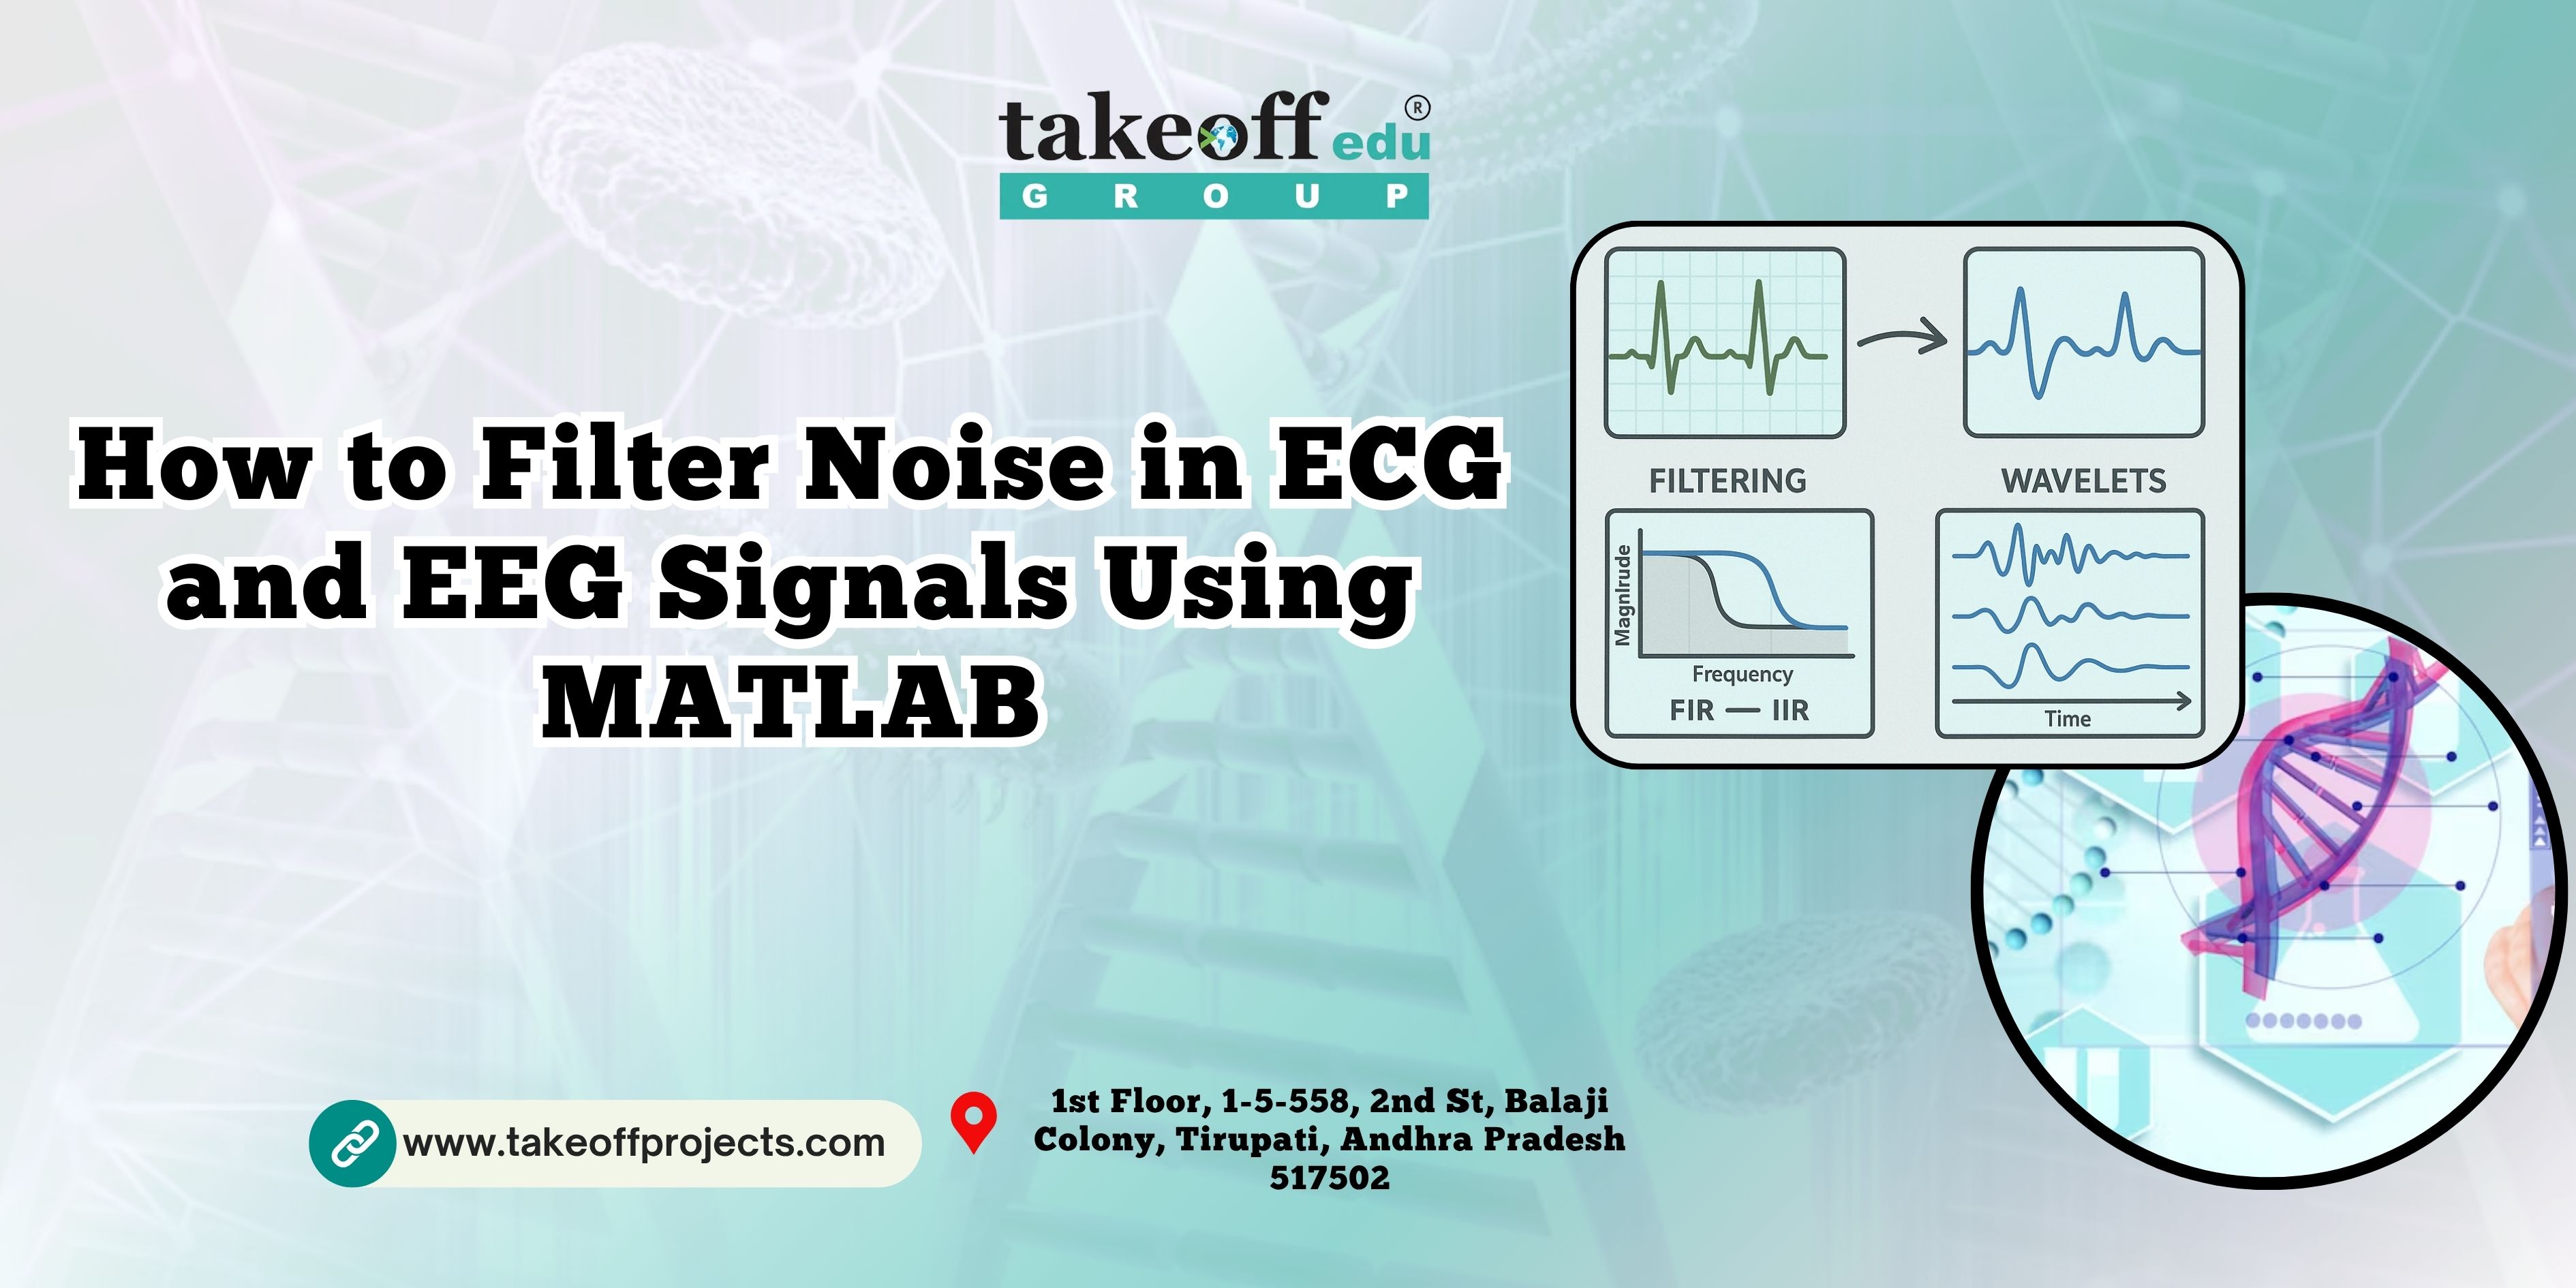 How to Filter Noise in ECG and EEG Signals Using MATLAB
  Real-Time Object Detection in Images Using MATLAB: A Practical Approach
 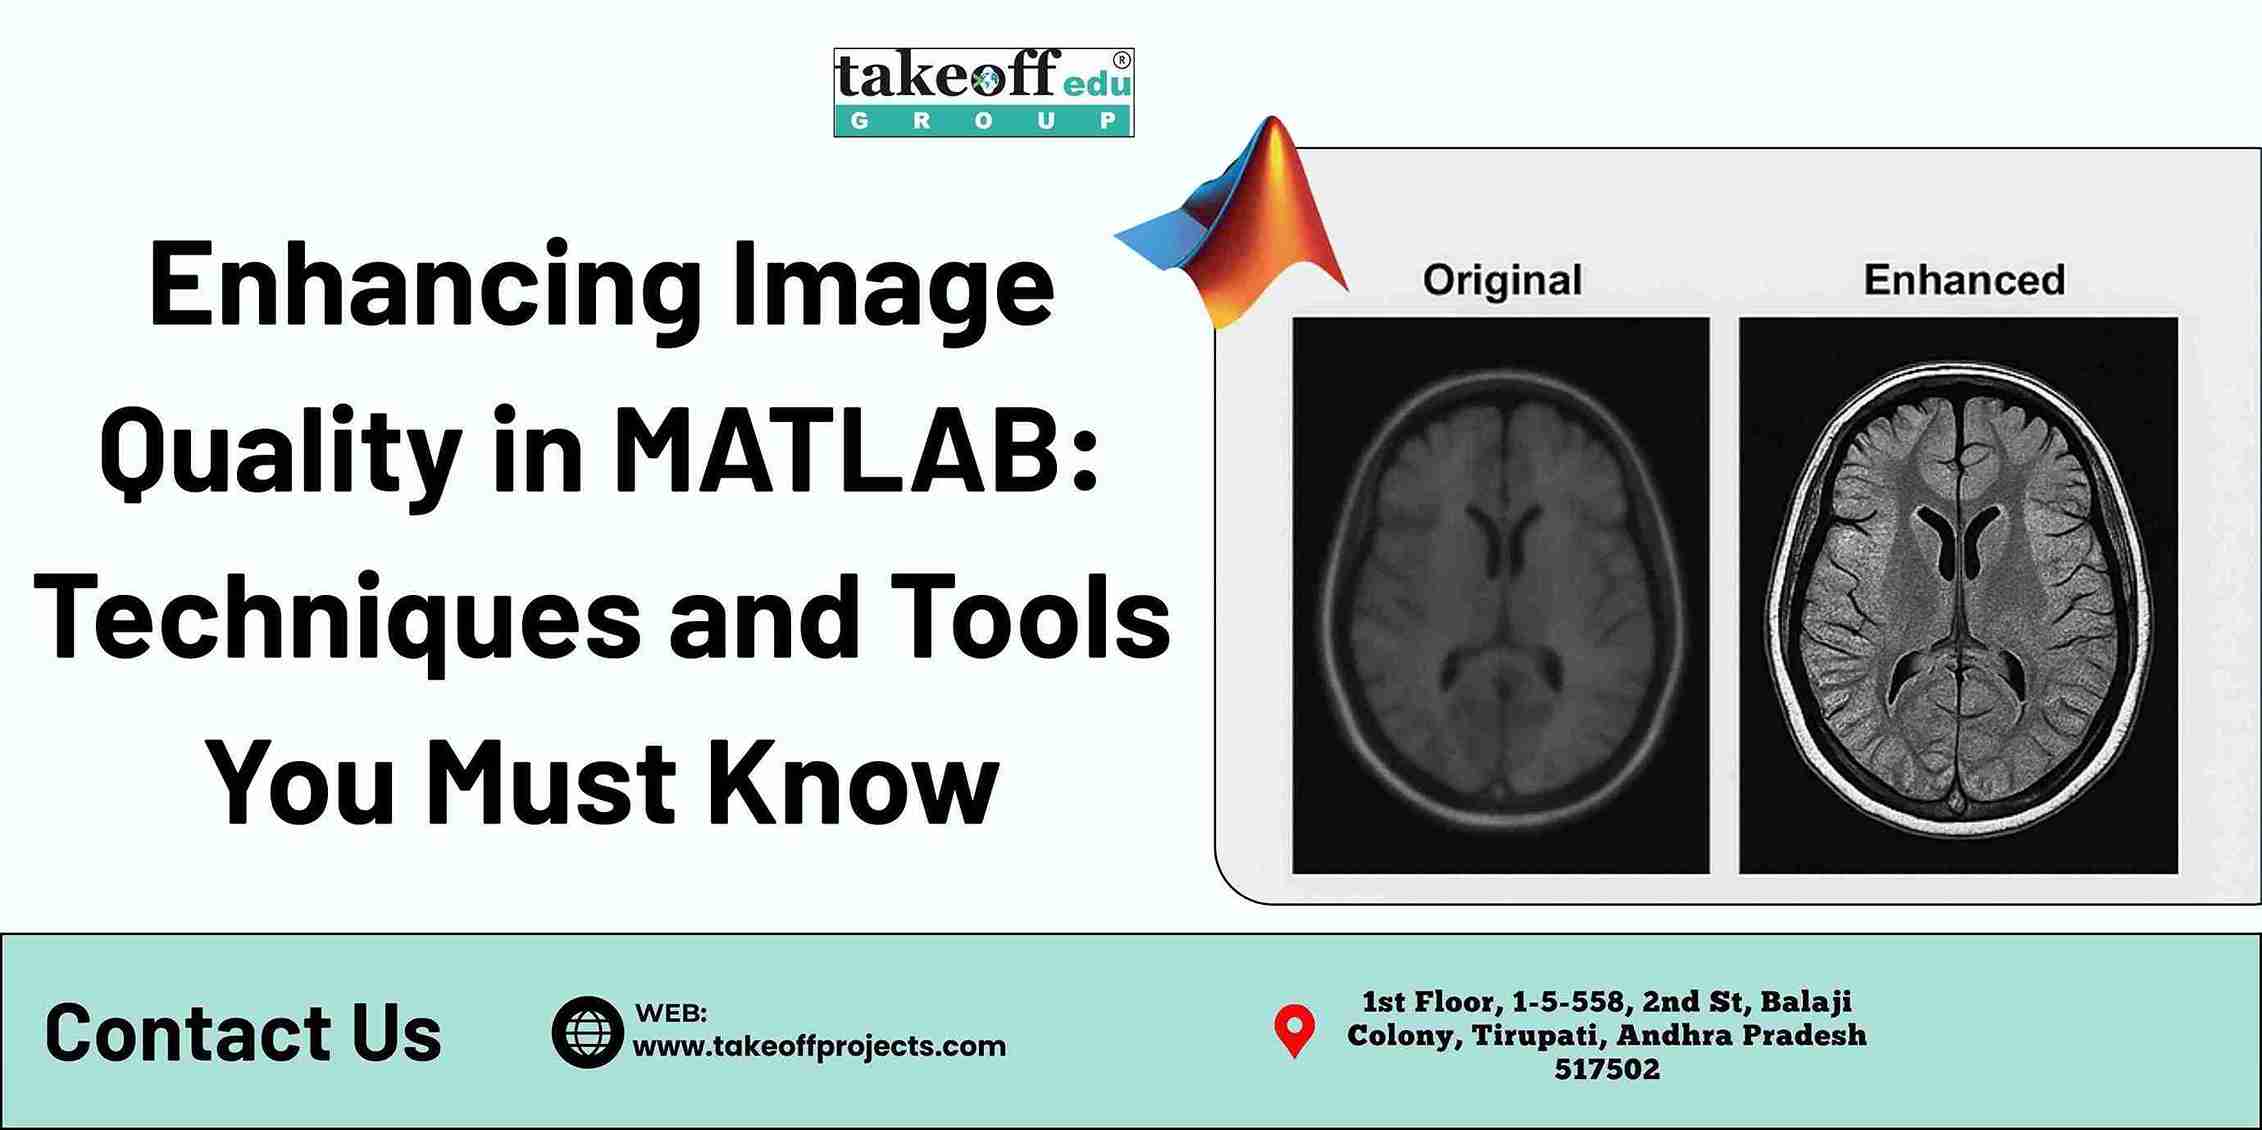 Enhancing Image Quality in MATLAB: Techniques and Tools You Must Know
  Medical Image Analysis in MATLAB: Applications in Diagnosis and Research
  Top 5 Projects on 5G Networks
  Top 5 Projects on Modulation Techniques
  Top 7 Projects on MIMO Transmissions
  Top 5 Device to Device Communications Projects
  Top 7 Image Detection Projects
  Top 7 Image Compression Projects
  Top 5 Fusion and Saliency Projects
  Top 7 Image Retrieval Projects
  Top 5 Image Denoising Projects
  Top 7 Projects on Security Applications
  Top 7 Image Enhancement Projects
  Top 10 Deep Learning Projects for B.Tech
  Top 5 Image Segmentation Projects
  Top 5 Artificial Neural Network Projects
 Paper Publishing


