Statistical Analysis Of Co2 Emission Based On Road Grade, Acceleration And Vehicle Specific Power For Public Utility Vehicles: An Iot Application
Abstract
In our transport system , the public utility vehicles (PUVs) are one of the top emitters of CO2 emissions (CO2e). Moreover, the need of quantifying the CO2e of PUV is important in reducing the emission. Hence, this paper focuses on the statistical evaluation of CO2e of PUV based on the parameters affecting it —road grade, acceleration, and vehicle specific power (VSP). An Internet of Things (IoT) system with onboard CO2 sensors, GPS receivers, wireless communication nodes and a base station, online elevation query, cloud server, and an online IoT monitoring dashboard were used to remotely gather, store and visualize the needed measurements. The correlations of CO2e according to these parameters were analyzed using statistical tools—histograms, box plots, and scatter plots. Results have shown that the correlation of PUV CO2e with respect to downhill roads, uphill roads, and acceleration follows a U-shaped curves with the trough from the ranges of -19% to -3% at -16%, 3% to 22% at around 13% to 16%, and from -4m/s2 to 3m/s2 at -2m/s2, respectively. Likewise, significant changes of CO2e were observed at different levels of VSP. Evidently, the mentioned factors have significantly affected the CO2e of the PUVs.
NOTE: Without the concern of our team, please don't submit to the college. This Abstract varies based on student requirements.
Block Diagram
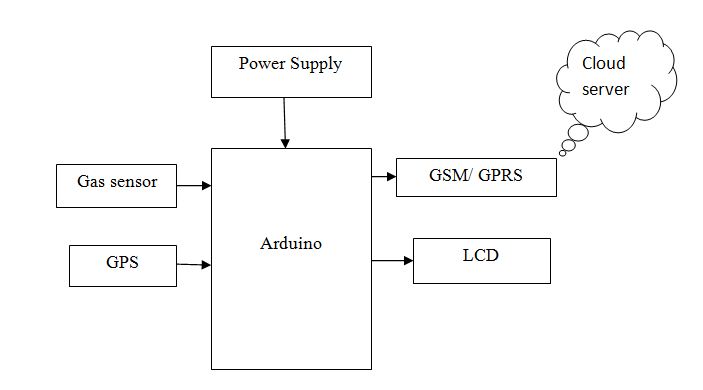
Specifications
Learning Outcomes
- Arduino Pin diagram and Architecture
- How to install Arduino IDE Software
- Setting up and Installation procedures for Arduino IDE
- Introduction to Arduino IDE
- Commands in Embedded C
- How to install Libraries?
- Basic coding in Embedded C
- Working of GSM
- Working of Gas Sensor
- How to interface Gas Sensor with Arduino
- Working of GPS
- Working of LCD
- How to interface LCD with Arduino?
- About Project Development Life Cycle:
- Planning and Requirement Gathering (software’s, Tools, Hardware components, etc.,)
- Schematic preparation
- Code development and debugging
- Hardware development and debugging
- Development of the Project and Output testing
- Practical exposure to:
- Hardware and software tools.
- Solution providing for real time problems.
- Working with team/ individual.
- Work on Creative ideas.
- Project development Skills
- Problem analyzing skills
- Problem solving skills
- Creativity and imaginary skills
- Programming skills
- Deployment
- Testing skills
- Debugging skills
- Project presentation skills
- Thesis writing skills


 Paper Publishing

Request Call Back
Would you like to receive a free callback now?
Choose the best time for callback:
Leave your message and we will contact you as soon as possible

6-2-85/B, Old Maternity Hospital Road, Thyagaraja Nagar, Tirupati, Andhra Pradesh – 517501
+91 9030333433
+91 9393939065
0877-2261612

Disclaimer - Takeoff Edu Group Projects are not associated or affiliated with IEEE in any way. The IEEE Projects mentioned here are mentioned in the context of student projects, whose ideas are derived from IEEE publications, not projects of or by IEEE.